 CorLab AI Agent


This Tech Assistant is designed to support you with clear insights into our company, our work, our services and the people behind our progress.
Powered by CorLab Tech © 2025







Geospatial Visualization
Geospatial visualization places data on a map, so location becomes part of the analysis. It shows where values are high or low, where events cluster and how regions compare, which a standard chart cannot do. The five map types below cover the most common needs, from shaded regions to individual points.


What map visualizations work best for

Regional comparison
Compare performance, volume, or any metric across countries, states, or custom territories side by side.
Distribution analysis
Visualize how data points, events, or resources are spread and concentrated across a geographic area.
Location-based trends
Identify spatial patterns over time, such as market expansion, demographic shifts, or infrastructure coverage.

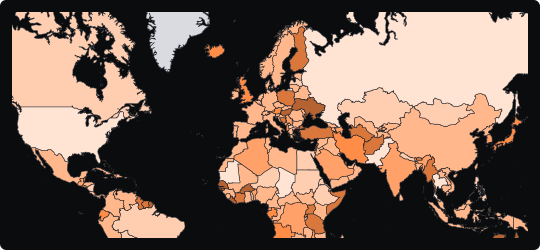
Choropleth Map
A region-filled map that encodes quantitative values through color intensity, making geographic distributions and regional disparities immediately visible.


Distributions


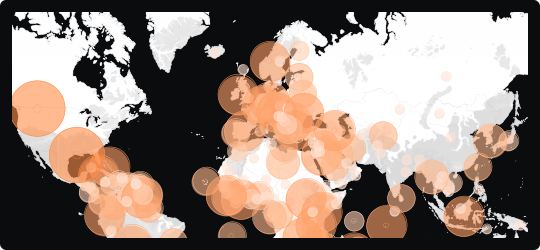
Bubble Map
A map that overlays proportionally sized circles on geographic locations, encoding magnitude through bubble area while preserving spatial context.


Comparison

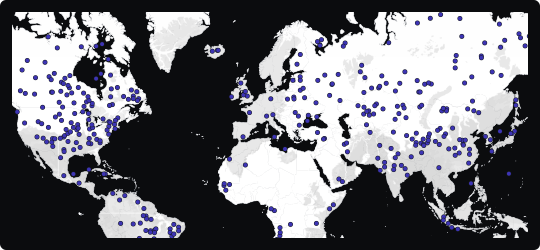
Scatter Map
Plots individual data points as dots at their exact coordinates, revealing clusters, density and gaps across a territory.
Distributions

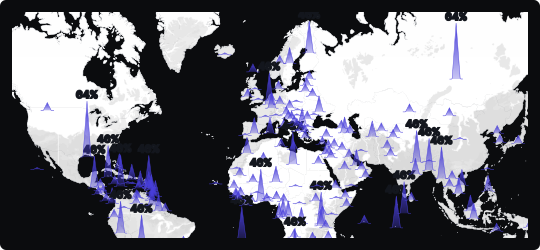
Spike Map
A map that rises vertical columns from geographic locations to encode magnitude, making it easy to spot high-value hotspots across a spatial canvas.
Comparison

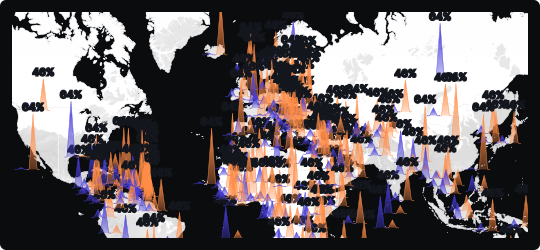
Double Spike Map
Renders two datasets as paired spikes from each location, so two measures can be compared across the same map in a single view.


Correlation
Comparison
Need maps built on your location data?
CorLab Tech builds map views into custom dashboards and operational tools, using your own location data, routes or regional metrics, with filters and drill-down from region to individual point.

See dashboard development
Questions and answers
Frequently Asked Questions
Quick answers on map types and building geospatial views into a dashboard.


What is geospatial visualization?
Geospatial visualization places data on a map, so location becomes part of the analysis. It shows where values are high or low, where events cluster and how regions compare, which a bar or line chart cannot show.


Which map type should I use?
What are common mistakes with map visualizations?
Can CorLab Tech build maps into our dashboards?
What is geospatial data?
Is geospatial data quantitative or qualitative?
We would like to load Google Tag Manager, which brings Google Analytics and a Google Ads audience tag with it, and Microsoft Clarity, which records how pages are used (clicks, scrolling, mouse movement) so that we can see where the site is hard to use. None of that is needed for the site to work, so it only loads if you agree, and you can change your mind at any time from the footer. Separately, Cloudflare measures this site's own performance without cookies and without identifying you; that runs either way and is explained in our Privacy Policy.