 CorLab AI Agent

This Tech Assistant is designed to support you with clear insights into our company, our work, our services and the people behind our progress.
Powered by CorLab Tech © 2025



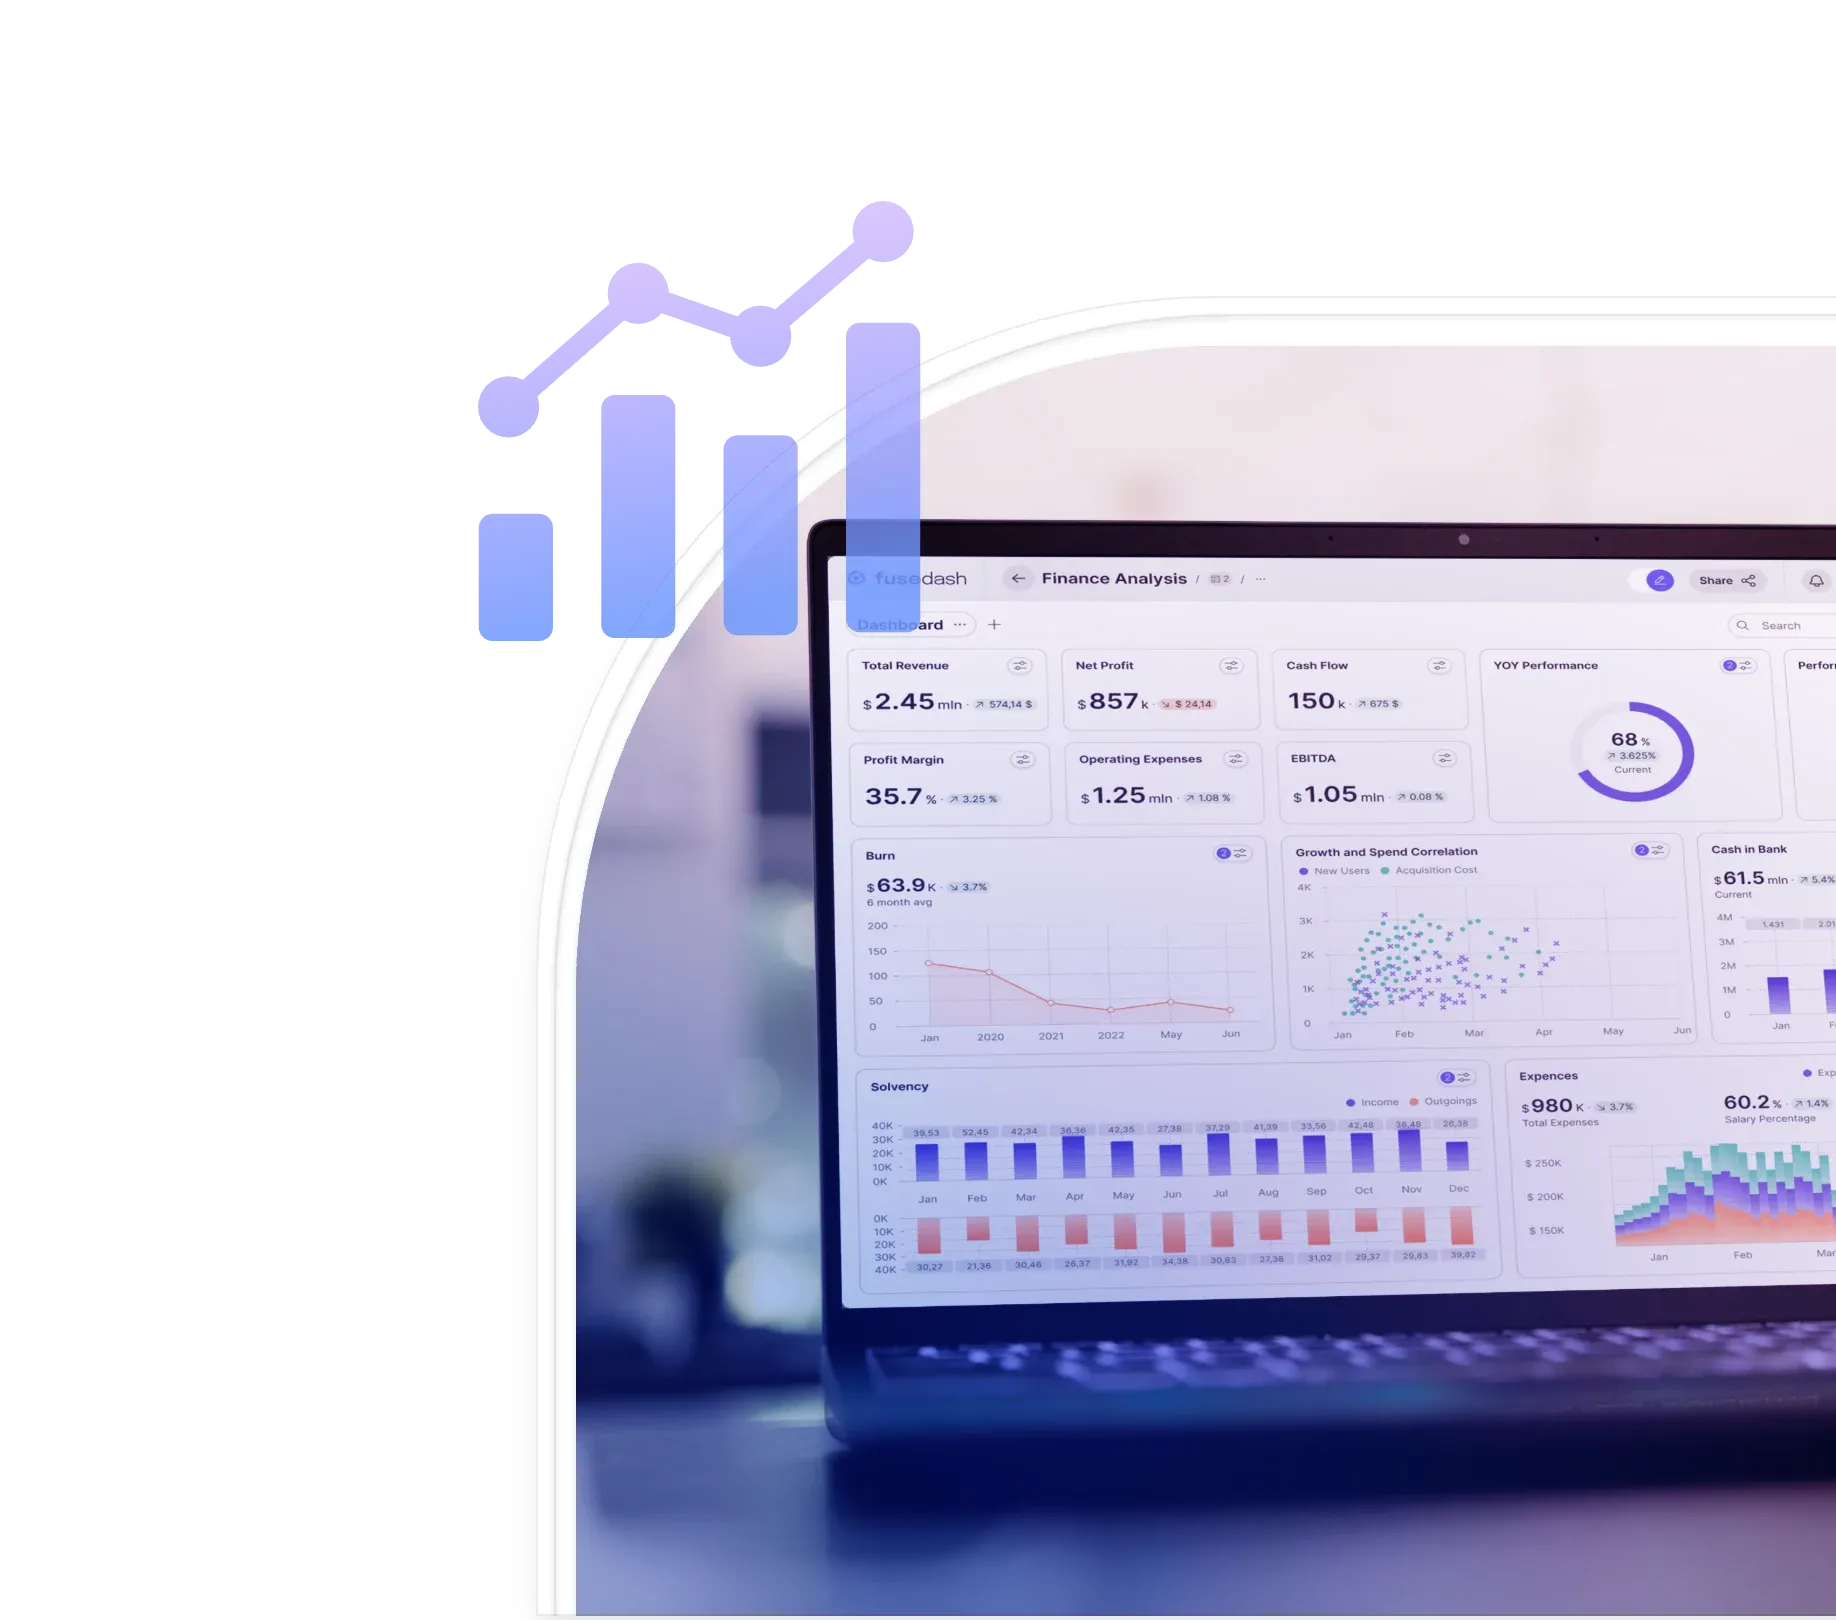
Dashboard development services
Dashboard Development Services, Engineered From the Data Up
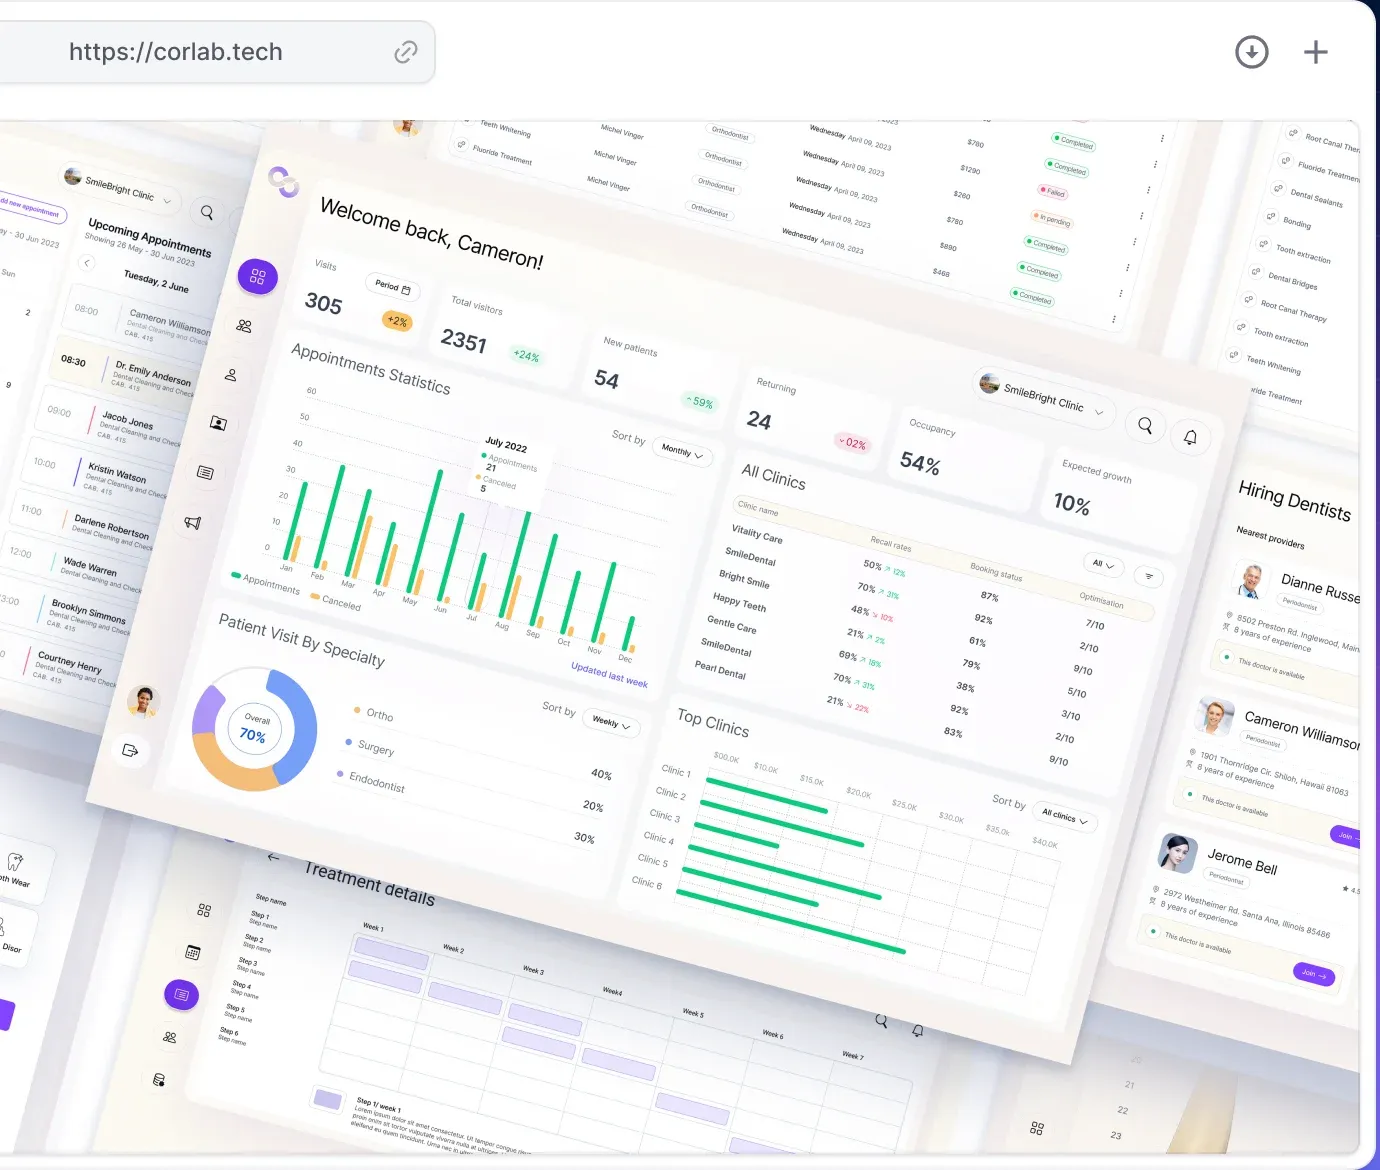
Custom dashboard development for products and operations: built on your data model, your refresh rate and your users' permissions.
Reviewed and listed on:
Want to learn more about the product we've built?


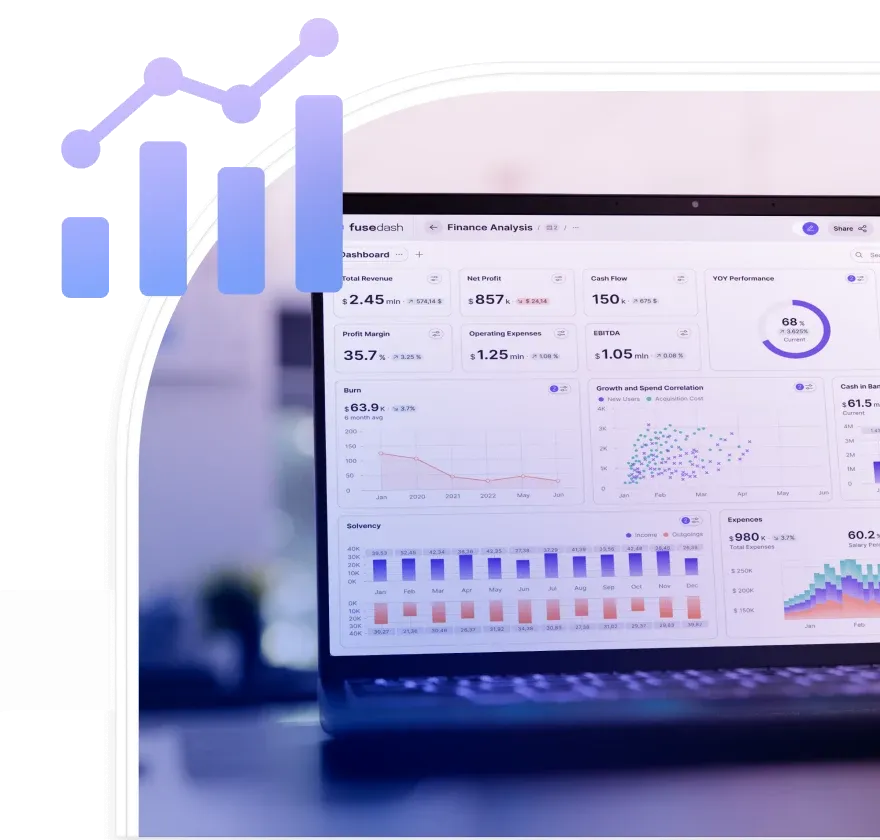
Definition
Dashboard development services cover the application and the data layer behind it: the pipelines, aggregations and permissions that decide what each user sees and how fresh it is. CorLab Tech builds dashboards as products, in code, on your own data model, rather than configuring them inside a BI tool.


Services
Dashboard Development Services We Build
CorLab builds five kinds of dashboards: embedded, operational, analytical, executive and real-time. Different audiences, different refresh budgets, one common requirement: the number on the screen has to be trusted, and trust is built in the data layer, not in the chart.

Embedded & Customer-Facing Dashboards
Dashboards that live inside your product, styled as your product, running on your application's own data model. Your users never leave your interface, and embedded analytics stops being a separate tool they have to learn.

Operational Dashboards
Operations dashboards for the people running the day: live queues, exceptions and SLAs. Built for the wall screen and the night shift, where a stale number causes a wrong decision.

Analytical Dashboards
Analysis views for teams that interrogate the data: filters, drill-downs and cohorts on warehouse or application data. The kind we most often advise a BI tool for instead; the three questions below say when.

Executive & KPI Dashboards
Performance management dashboards that answer the Monday question in one screen: what changed, why, and who owns it.

Real-Time Dashboards
Live pipelines for numbers measured in seconds: streaming feeds, pre-aggregation and caching decided before the first chart is drawn.

UI layer

ReactJS

Next.js

Angular

D3.js
Data layer

Postgres

MongoDB

ElasticSearch

Neo4j

Go Lang

Node.js

Qdrant

ChromaDB



The Friction We Fix
Why Dashboards Fail in Production
Dashboards rarely fail because the charts are wrong. They fail in the data layer, usually in one of six ways.

The query that was instant with test data takes nine seconds with a year of real data.

Aggregation happens in the browser, so the dashboard slows down as the business grows.

Permissions were bolted on last, so everyone sees everything, and legal finds out.

Two dashboards show two different numbers for the same metric, and both teams are sure.

The refresh rate was never budgeted, so "real time" quietly means "as of last night."

Nobody owns the metric definitions, so every reorg breaks every chart.

Ways in comparison
Operational, Analytical or Embedded
Five products, three architectures: executive dashboards are analytical underneath, and real-time is a budget any of them can pay for. Most business dashboard development lands in one of the three, and you do not need the vocabulary to place yours. Three questions settle it.

Who reads it, and what happens next?
A team steering live operations needs an operational dashboard: current states, an action attached to every number. An analyst working through changing questions needs an analytical one. When the reader is your own customer, the dashboard is embedded analytics: a product feature, with product-grade engineering behind it.
How fresh does the number have to be?
Seconds means streaming pipelines and pre-computed numbers, and it prices like it. Hours means the warehouse carries the load and the build gets simpler. Refresh is the biggest cost lever you control, so we budget it per metric in week one, before anything is quoted.
Where does it have to live?
On the ops floor, in an analyst's browser, or inside your product. The last answer carries the most engineering, per-user permissions and your design system included, and it is where custom code beats any BI license.
If every answer points at internal analysts, a BI tool may be the better buy. That comparison lives on our data visualization page.
See the comparison
Software Development
The Data Architecture Behind a Dashboard
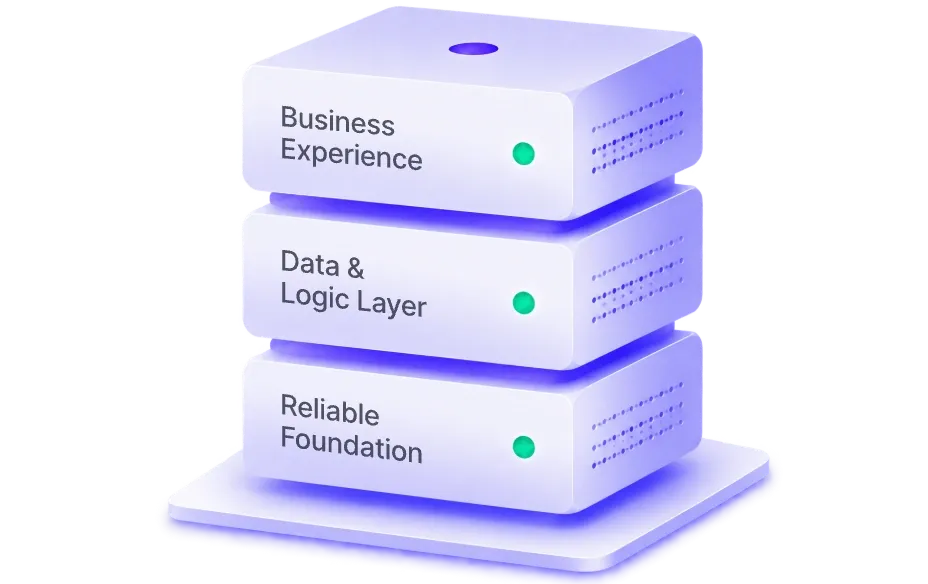
The chart is the last decision in a dashboard project. These four come first, and they decide whether the dashboard survives real data.


Pre-aggregate or query live.
Decided per metric, from the refresh budget and the data volume. Getting it wrong is where the nine-second query comes from.

Cache with an expiry someone chose.
Every number gets a freshness budget, written down. "Real time" should be a number, not a mood.

Permissions scoped in the data layer.
Role-based access enforced in the queries themselves, so a clever URL never shows the wrong patient or the wrong client.

Metric definitions live in one place.
One definition per KPI, versioned, shared by every screen, so two dashboards cannot disagree about revenue.
Industries
Industries We Build Dashboards For
The dashboards worth building in code live where the data is regulated, live, or both.

Healthcare
Clinical and patient KPI views, role-scoped to HIPAA expectations.

Artificial Intelligence
Model behavior and monitoring surfaces, kept honest by real metrics.



Building the Right Dashboard
How a Dashboard Project Runs
Focused on your unique needs, our dedicated team of developers and consultants makes it easy to build your software solution through our complete development approach.

Week 1, the metric workshop
KPIs named, definitions written, refresh budgets set, run by the dashboard consultants who will build it. Deliverable: the metric spec. You approve it before anything is designed.

Week 2, data architecture
Sources mapped, aggregation strategy chosen per metric, permissions model drafted.

Weeks [3–5], build
Dashboard developers work on your real data from the first demo, never on placeholder numbers.

Week [6], hardening
Permissions, load and edge cases. The nine-second query is found here, while it is still ours to fix.

Launch and iterate
Usage tracked from day one; metric definitions reviewed quarterly.
A Better Fit Starts Here
When a BI Tool Is the Better Answer
If your users are your own analysts, the questions change every week, and no dashboard needs to live inside a product, buy Power BI or Tableau and configure it well. Building custom would cost more and arrive later, and we will tell you that in the first call.
Build custom when the dashboard faces your customers, runs on your application's data model, or has a refresh budget a BI license cannot hit. That is when a dashboard development company earns its cost.

Tell us the number you need to trust.
A 30-minute call about your data and who needs to see it. You leave with an architecture sketch and a realistic range, whether or not we build it.
 Book a discovery call
F.A.Q
Dashboard Development FAQ

How much does dashboard development cost?
Scope, data complexity and refresh budget drive it. The week-one metric spec gives you a real range before any build starts.

How long does a dashboard project take?
Can you build an embedded dashboard inside our product?
Can you build on our existing database or warehouse?
Can the dashboard update in real time?
Who maintains the dashboard after launch?