





Double Spike Map

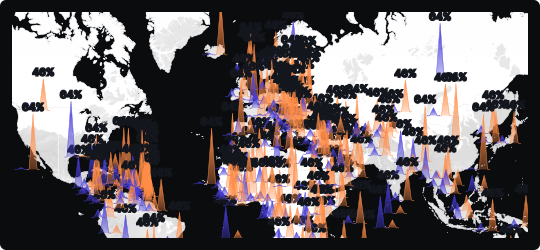
Spikes (Double) Map
The double spikes map extends the standard spike map by rendering two sets of columns per location — typically in contrasting colors — rising from the same geographic point. This allows two related or competing metrics to be compared spatially without switching between views or overlaying separate maps.
Side-by-side geographic comparison
Two spike series at each location make it immediately clear where one metric dominates the other, and where the two are balanced — revealing competitive dynamics or proportional relationships across geography.
Directional magnitude
Spike height encodes value, so taller columns instantly communicate higher quantities. The dual format adds a comparative layer that a single spike map cannot provide alone.
Correlation & divergence
Where spikes of both colors are tall, a location has high values on both metrics. Where they diverge, the map exposes geographic imbalances — a powerful signal for resource allocation or market analysis.
When to avoid it
Dense regions can become visually overwhelming when both spike sets overlap heavily. Keep color contrast strong and use interactivity to let users isolate each series when needed.
Best suited for comparative geographic analysis — such as supply vs. demand by region, two competing product lines by territory, or actual vs. target performance across locations.
Similar Charts

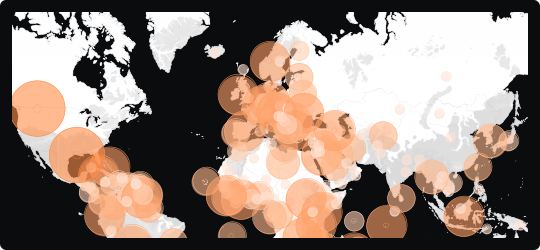
Bubble Map
A map that overlays proportionally sized circles on geographic locations, encoding magnitude through bubble area while preserving spatial context.


Comparison


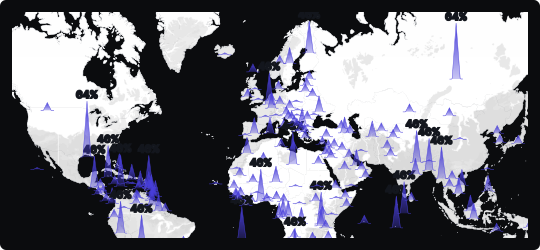
Spike Map
A map that rises vertical columns from geographic locations to encode magnitude, making it easy to spot high-value hotspots across a spatial canvas.
Comparison


