





Bubble Map

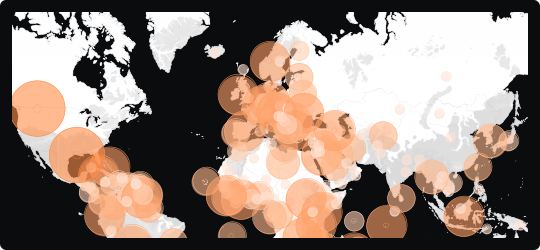
Bubble Map
A bubble map places circles directly onto a geographic canvas, positioning each bubble at a specific location and scaling its size to represent a quantitative value. Unlike a choropleth, it is not bound by regional borders — bubbles can represent cities, facilities, events, or any point-based data, making it more precise for location-specific analysis.
Magnitude at a glance
Larger bubbles immediately draw attention to high-value locations, creating a natural visual hierarchy across the map without requiring color gradients.
Point-level precision
Because bubbles are tied to exact coordinates rather than regions, they are ideal for datasets where the specific location matters — store locations, incident reports, sensor readings, or infrastructure points.
Correlation potential
A second variable can be encoded through bubble color, enabling simultaneous comparison of two dimensions across the geographic space.
When to avoid it
In dense areas, overlapping bubbles can obscure each other and make individual values hard to read. Use transparency, interactivity, or clustering to mitigate this in data-heavy maps.
Best suited for logistics, network analysis, market concentration studies, and any scenario where magnitude needs to be anchored to a specific point on the map rather than a regional boundary.
Similar Charts

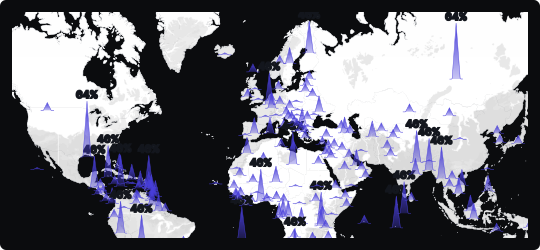
Spike Map
A map that rises vertical columns from geographic locations to encode magnitude, making it easy to spot high-value hotspots across a spatial canvas.


Comparison


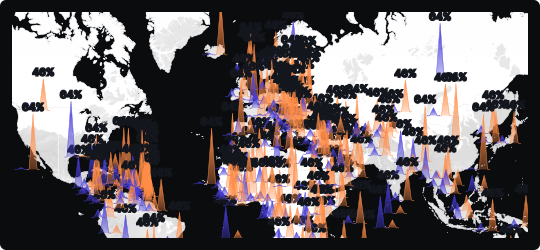
Double Spike Map
Renders two datasets as paired spikes from each location, so two measures can be compared across the same map in a single view.


Correlation
Comparison


