





Scatter Map

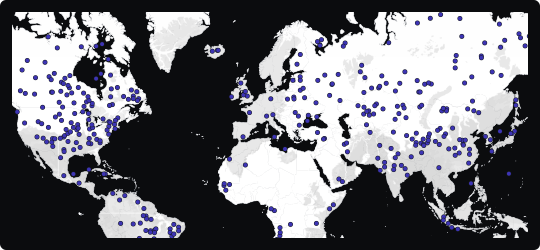
Scatter Map
A scatter map is the geographic equivalent of a scatterplot — each data point is placed at its precise location on the map as a dot, with no aggregation or regional averaging. This makes it the most granular of all geospatial chart types, preserving the full resolution of the underlying dataset.
Raw distribution visibility
Every individual event, record, or observation is represented, making it possible to see exactly where things happen — not just which region they fall in.
Cluster & gap detection
Dense concentrations of dots reveal hotspots, while empty areas highlight where activity is absent. These patterns are often invisible in aggregated regional maps.
Additional encoding
Dot color or size can encode secondary variables such as category, magnitude, or time, turning a simple location map into a rich multi-dimensional spatial analysis.
When to avoid it
With very large datasets, overplotting makes individual points indistinguishable. In such cases, use transparency, dot sizing, or switch to a density or heatmap layer to preserve pattern visibility.
Best suited for incident mapping, customer location analysis, field asset tracking, and any scenario where the precise geographic position of individual records is the primary analytical concern.
Similar Charts

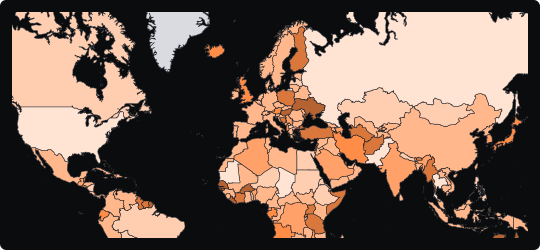
Choropleth Map
A region-filled map that encodes quantitative values through color intensity, making geographic distributions and regional disparities immediately visible.


Distributions


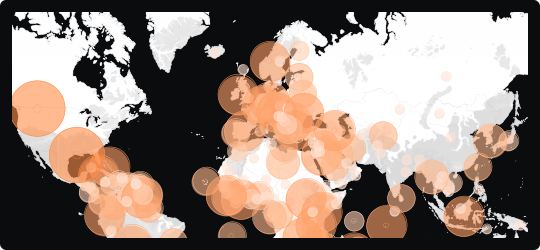
Bubble Map
A map that overlays proportionally sized circles on geographic locations, encoding magnitude through bubble area while preserving spatial context.


Comparison


