





Spike Map

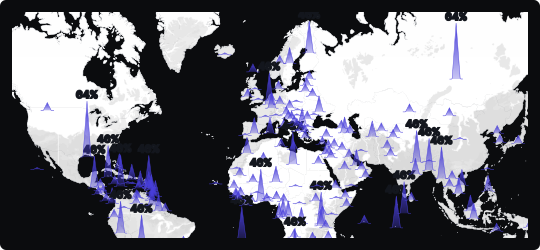
Spikes Map
A spikes map plants vertical columns — or spikes — at geographic coordinates, with each column's height proportional to the value it represents. It combines the spatial precision of a scatter map with the magnitude clarity of a bar chart, translated onto a geographic plane.
Immediate hotspot detection
Tall spikes visually dominate the map, drawing the eye directly to the highest-value locations without requiring the viewer to scan individual numbers or legends.
Spatial density reading
Where spikes cluster together, the map communicates both geographic concentration and aggregate magnitude — revealing not just where something is happening, but how intensely.
Height as a natural metaphor
The vertical dimension intuitively encodes "more," making spike maps accessible to a broad audience even without prior data visualization experience.
When to avoid it
In very dense datasets, spikes can overlap and obscure each other, creating visual noise. Aggregating nearby points or using interactivity to filter by value range can help maintain readability.
Best suited for visualizing event frequency, sales volume, population concentration, or any metric where geographic magnitude needs to be communicated with dramatic visual clarity.
Similar Charts

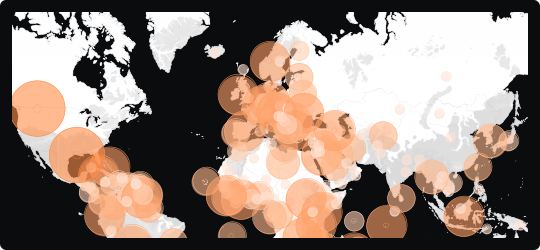
Bubble Map
A map that overlays proportionally sized circles on geographic locations, encoding magnitude through bubble area while preserving spatial context.


Comparison


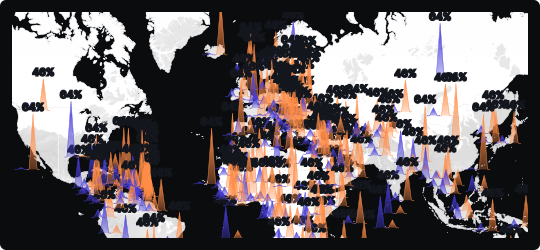
Double Spike Map
Renders two datasets as paired spikes from each location, so two measures can be compared across the same map in a single view.


Correlation
Comparison


