





Stacked Vertical Bar Chart

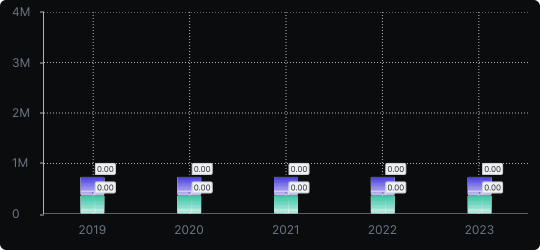
Stacked Vertical Bar Chart
A stacked vertical bar chart extends the standard bar chart by splitting each bar into segments, where each segment represents a sub-category. The full height of the bar reflects the total, while each colored segment shows its proportional contribution.
When to use it?
Use a stacked bar chart when you want to show both the total value per category and how that total is broken down into parts. It is ideal for budget breakdowns, population composition, or sales by product line.
What makes it effective?
It communicates two levels of information simultaneously: the overall magnitude and the internal structure. This reduces the need for multiple separate charts.
When to avoid it?
Avoid stacked bars when you need to compare middle segments across categories — since they don't share a common baseline, precise comparisons become difficult. If part-to-whole accuracy is critical, consider a 100% stacked bar or small multiples instead.
Keep the number of segments per bar limited (ideally 3–5) to maintain legibility and ensure color contrast is strong enough to distinguish each layer.
Similar Charts

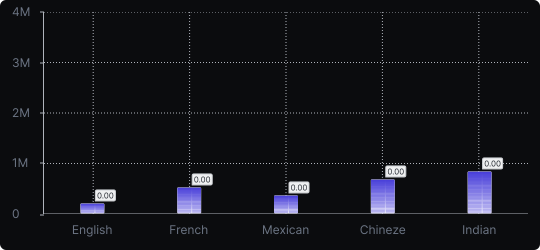
Vertical Bar Chart
The most common way to compare amounts: one vertical bar per category, with bar height showing the value. Clear, familiar and easy to read at a glance.


Comparison


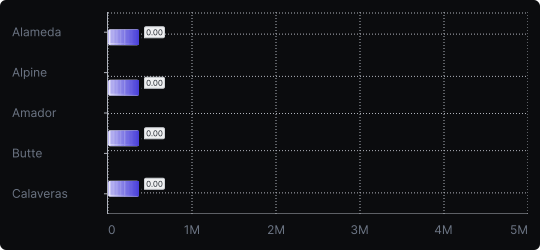
Horizontal Bar Chart
A variation of the bar chart where categories are placed on the vertical axis and values extend horizontally, ideal for long or numerous category labels.
Comparison


