





Vertical Bar Chart

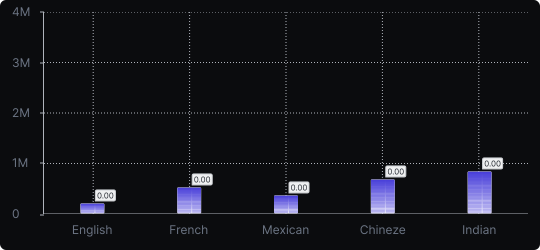
Vertical Bar Chart
A vertical bar chart is one of the most universally understood data visualizations. It displays categorical data as rectangular bars rising from a horizontal baseline, where the height of each bar corresponds to its value.
When to use it?
Choose a vertical bar chart when you have a limited number of discrete categories and want to compare their values directly. It works especially well when category labels are short and when the magnitude of differences between values matters.
What makes it effective?
The vertical orientation naturally aligns with how most people interpret height as quantity. The human eye can quickly detect which bar is tallest, making comparisons fast and intuitive.
When to avoid it?
Avoid vertical bars when you have many categories (more than ~10), as the chart becomes crowded. In that case, consider a horizontal bar chart instead.
Use vertical bar charts as your default choice for simple category comparisons — they require no learning curve and communicate clearly across all audiences.
Similar Charts

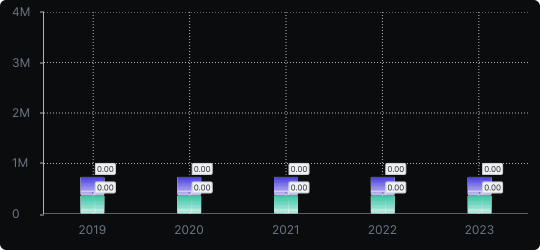
Stacked Vertical Bar Chart
A vertical bar chart that layers multiple data series within each bar, showing both the total and the composition of each category.


Comparison


Proportions


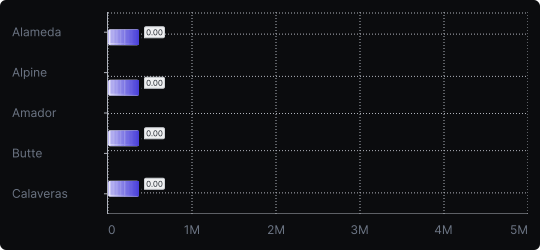
Horizontal Bar Chart
A variation of the bar chart where categories are placed on the vertical axis and values extend horizontally, ideal for long or numerous category labels.
Comparison


