CorLab AI Agent

This Tech Assistant is designed to support you with clear insights into our company, our work, our services and the people behind our progress.

Powered by CorLab Tech © 2025

Start strong, build smart, and launch your custom software with peace of mind.

Horizontal Bar Chart

Horizontal Bar Chart
Horizontal Bar Chart

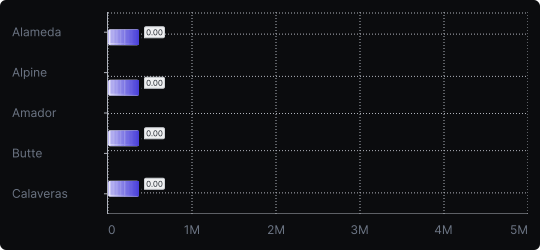
A horizontal bar chart is functionally identical to a vertical bar chart but rotated 90 degrees. Categories appear on the vertical axis and bars extend to the right, with length encoding the value.

  • When to use it? 

    This chart excels when category names are long (e.g., country names, product titles, survey responses), when you have many categories, or when you want a natural left-to-right reading flow for ranked data.

  • What makes it effective? 

    Long labels fit comfortably next to horizontal bars without truncation or rotation. It also lends itself naturally to ranking, as the longest bar clearly dominates visually at the top.

  • When to avoid it? 

    Avoid it for time-series data, where a vertical bar or line chart is more conventional. Also avoid it if your audience expects a standard vertical orientation for a specific context (e.g., financial reporting).

Horizontal bar charts are especially powerful in dashboards and reports where readability of labels is a priority.

Similar Charts

Vertical Bar Chart

Vertical Bar Chart

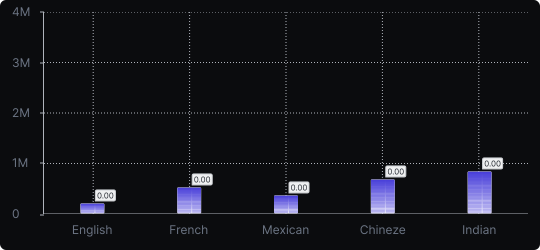
The most common way to compare amounts: one vertical bar per category, with bar height showing the value. Clear, familiar and easy to read at a glance.

Comparison

Comparison

arrow
Stacked Vertical Bar Chart

Stacked Vertical Bar Chart

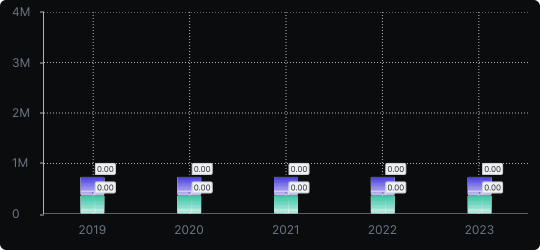
A vertical bar chart that layers multiple data series within each bar, showing both the total and the composition of each category.

Comparison

Comparison

Proportions

Proportions

arrow

Need these charts in your own product?

CorLab Tech builds custom dashboards and data visualizations on top of your own data: connected to your systems, fast with large datasets and designed for the people who use them every day.

icon

See dashboard development

Questions and answers

Frequently Asked Questions

Quick answers on choosing chart types and building them into a dashboard.

Hide

What are the main types of data visualization charts?

Most charts answer one of five questions: how values compare (bar, lollipop, radar), how they change over time (line, area), how they are distributed (histogram, box plot), how they relate (scatter plot, bubble, matrix) and how a whole splits into parts (pie, donut, stacked bars). The filter above groups all 21 charts by these questions.

Show

How do I choose the right chart type?

Show

Which chart types work best in dashboards?

Show

Can CorLab Tech build these charts into our own product?

Show

What chart type shows trends over time?

Show

What is the difference between a chart and a graph?