





Stacked Horizontal Bar Chart

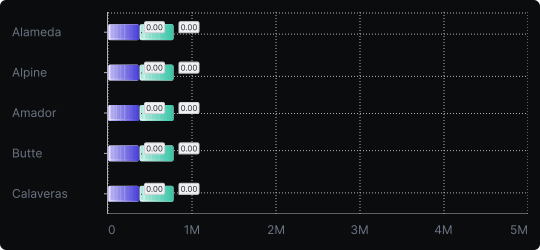
Stacked Horizontal Bar Chart
The stacked horizontal bar chart combines the readability of a horizontal layout with the compositional storytelling of stacked bars. Each bar is divided into colored segments representing sub-categories, and the full length reflects the total.
When to use it?
Use this chart when your categories have long names and you also need to show how each category breaks down into parts. It is well-suited for survey results, demographic comparisons, or multi-stage process breakdowns.
What makes it effective?
It handles long category labels gracefully while still communicating structure within each bar. The 100% stacked variant (where all bars reach the same length) is particularly effective for comparing proportions across categories.
When to avoid it?
As with all stacked charts, comparing non-baseline segments across bars is difficult. If precise segment comparisons matter, use grouped bars or small multiples instead.
Ensure a clear and consistent color legend, and limit the number of segments to avoid visual clutter.
Similar Charts

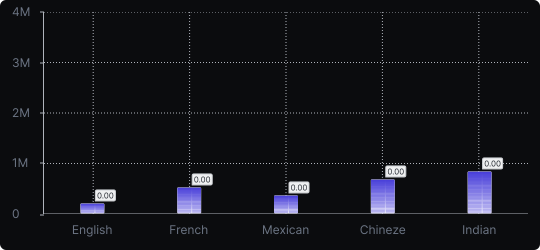
Vertical Bar Chart
The most common way to compare amounts: one vertical bar per category, with bar height showing the value. Clear, familiar and easy to read at a glance.


Comparison


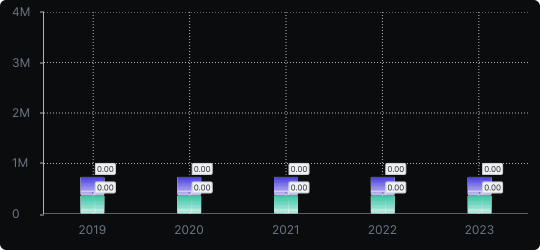
Stacked Vertical Bar Chart
A vertical bar chart that layers multiple data series within each bar, showing both the total and the composition of each category.
Comparison


Proportions


