





Stacked Area Chart

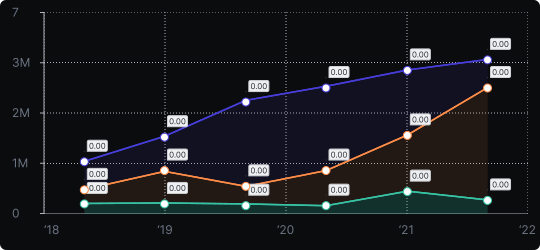
Stacked Area Chart
A stacked area chart layers multiple data series on top of each other, filling the areas between them. Unlike a regular area chart, each series starts where the previous one ends, so the top edge represents the total across all series.
When to use it?
Use it when you want to show how multiple components contribute to a total over time. It is particularly effective for visualizing portfolio breakdowns, market share over time, or energy consumption by source.
What makes it effective?
It communicates both individual series trends and the cumulative total in a single view. The overall height of the chart shows aggregate growth or decline, while each colored band tells the story of a specific component.
When to avoid it?
Reading the absolute values of non-bottom series is difficult because they don't share a common baseline. If comparing individual series values precisely matters more than understanding the total, use a grouped line chart or small multiples instead.
A 100% stacked area variant is useful when proportional change over time is more important than absolute values.
Similar Charts

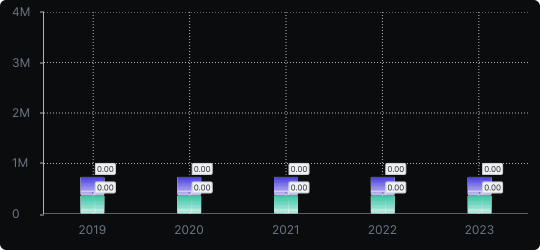
Stacked Vertical Bar Chart
A vertical bar chart that layers multiple data series within each bar, showing both the total and the composition of each category.


Comparison


Proportions


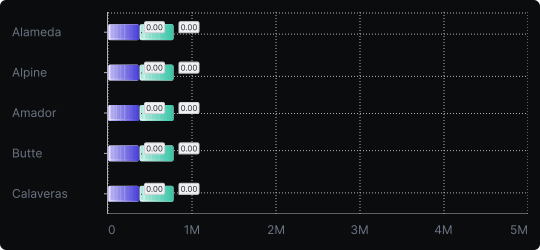
Stacked Horizontal Bar Chart
A horizontal bar chart that stacks multiple data series within each bar, combining compositional detail with easy label readability.
Comparison
Proportions


