





Radial Bar Chart

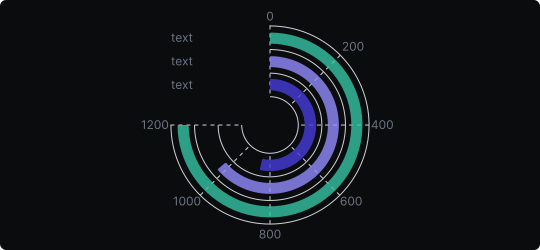
Radial Bar Chart
A radial bar chart arranges bar segments in a circular layout, with each bar curving around the center. The length of each arc represents the value of that category, similar to how bar length works in a standard bar chart — but rendered in polar coordinates for a visually distinctive effect.
When to use it?
Use a radial bar chart when you want to compare values across categories with a visually engaging, compact design — especially suited to dashboards, infographics, and presentations where aesthetics matter. It works well for a small-to-medium number of categories.
What makes it effective?
The circular format uses space efficiently and creates a striking visual that draws attention. It pairs well with KPI cards and summary panels. When categories are arranged from largest to smallest, the overall design becomes an elegant ranking visualization.
When to avoid it?
Radial bar charts are less precise than linear bar charts because arcs at larger radii appear longer even for equal values. They are also harder to read for audiences unfamiliar with the format. Avoid them when accuracy and direct comparison are priorities over aesthetics.
Radial bar charts are best used as presentation-layer visualizations where visual impact is as important as data clarity.
Similar Charts

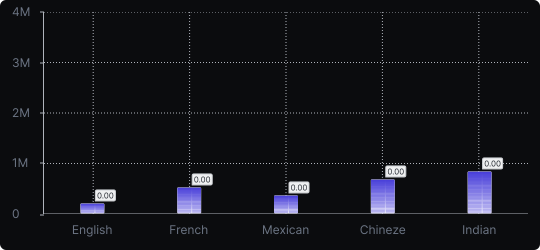
Vertical Bar Chart
The most common way to compare amounts: one vertical bar per category, with bar height showing the value. Clear, familiar and easy to read at a glance.


Comparison


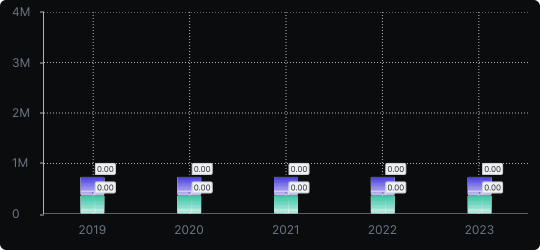
Stacked Vertical Bar Chart
A vertical bar chart that layers multiple data series within each bar, showing both the total and the composition of each category.
Comparison


Proportions


