





Radar Chart

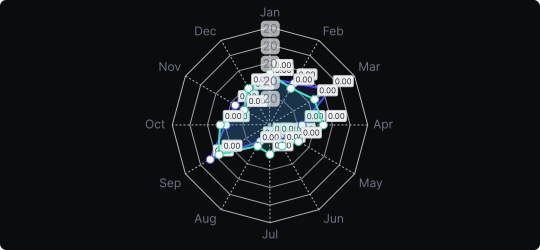
Radar Chart (Spider Chart)
A radar chart displays multivariate data on a two-dimensional chart with multiple axes radiating from the center, each representing a different variable. Data points are plotted along each axis and connected by lines (or filled areas), forming a polygonal shape whose form reveals the overall profile of each data series.
When to use it?
Radar charts excel at profiling entities across multiple dimensions simultaneously — for example, comparing athletes across speed, strength, endurance, and agility, or comparing products across price, quality, support, and features. They are particularly effective for revealing strengths and weaknesses at a glance.
What makes it effective?
The polygonal shape gives each entity a distinct visual signature. Readers can immediately compare two overlapping profiles and see which dimensions one entity dominates vs. underperforms. It is especially impactful in competitive analysis and performance reviews.
When to avoid it?
Radar charts become cluttered and hard to read with more than 6–7 axes or more than 3–4 overlapping series. The circular axis layout also makes precise value reading difficult. For many variables or series, a parallel coordinate plot or grouped bar chart is more appropriate.
Use filled radar charts with transparency when overlapping two entities, so both profiles remain visible and comparable.
Similar Charts

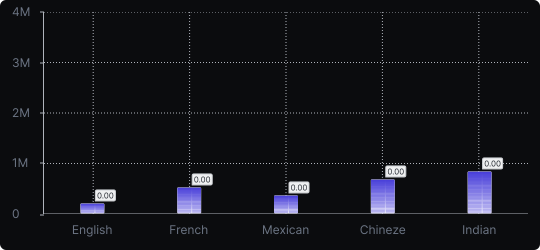
Vertical Bar Chart
The most common way to compare amounts: one vertical bar per category, with bar height showing the value. Clear, familiar and easy to read at a glance.


Comparison


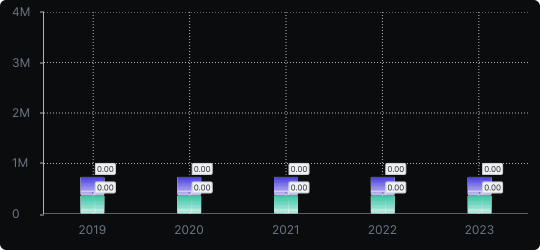
Stacked Vertical Bar Chart
A vertical bar chart that layers multiple data series within each bar, showing both the total and the composition of each category.
Comparison


Proportions


