





Polar Area Chart

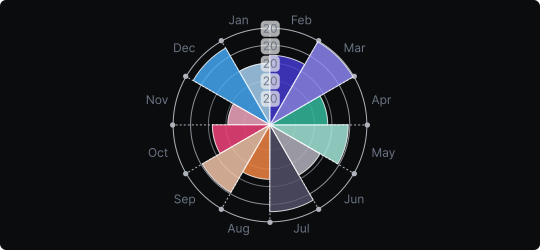
Polar Area Chart
A polar area chart displays categories arranged radially around a central point, with each segment extending outward from the center. Unlike a pie chart where all segments share the same radius but differ in angle, polar area charts give each segment the same angle but vary the radius — so area encodes value.
When to use it?
Use a polar area chart when your data has a natural circular or cyclical structure — such as monthly performance across a year, directional data, or any dataset where the circular layout reinforces the meaning of the categories. It is particularly effective for showing seasonal or periodic patterns.
What makes it effective?
The circular layout immediately conveys the idea of cyclicality or completeness. Segments with larger values visually dominate the circle, making high-performing periods or categories stand out at a glance.
When to avoid it?
Like pie charts, polar area charts make precise comparisons difficult due to the use of area and radius as encodings. They can also be misleading because area grows as the square of the radius, making differences appear larger than they are. Use with a clear scale and a limited number of categories.
Polar area charts are a visually engaging choice for periodic or directional data when aesthetics and intuitive layout matter.
Similar Charts

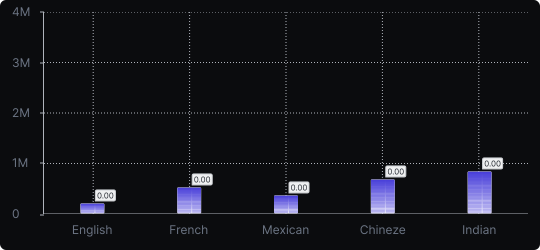
Vertical Bar Chart
The most common way to compare amounts: one vertical bar per category, with bar height showing the value. Clear, familiar and easy to read at a glance.


Comparison


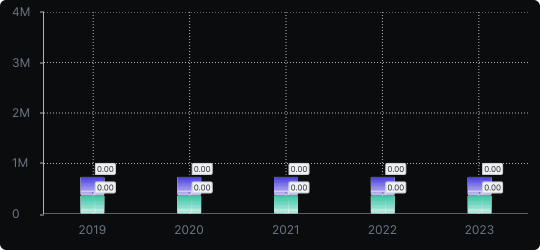
Stacked Vertical Bar Chart
A vertical bar chart that layers multiple data series within each bar, showing both the total and the composition of each category.
Comparison


Proportions


