





Pie Chart

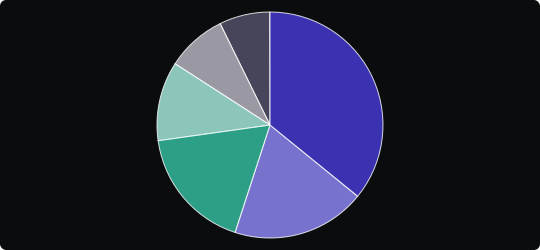
Pie Chart
A pie chart divides a circle into slices, where each slice's angle and area are proportional to the value it represents. It is one of the oldest and most recognized chart types, instantly communicating part-to-whole relationships.
When to use it?
Use a pie chart when you have a small number of categories (ideally 2–5) and the primary message is how each part relates to the total. It is effective when one segment is notably dominant and you want to highlight that contrast visually.
What makes it effective?
Pie charts leverage the intuitive metaphor of dividing up a whole, which most audiences grasp immediately. They communicate "share" and "proportion" more naturally than bar charts in many everyday contexts.
When to avoid it?
Pie charts become unreliable when comparing similarly sized slices — humans are poor at estimating angular differences. Avoid them with more than 5–6 categories, as small slices become unreadable. Never use 3D pie charts, as perspective distortion makes comparisons inaccurate.
When precise comparison across segments is important, consider a bar chart instead. Reserve pie charts for clear dominance stories or simple two-way splits.
Similar Charts

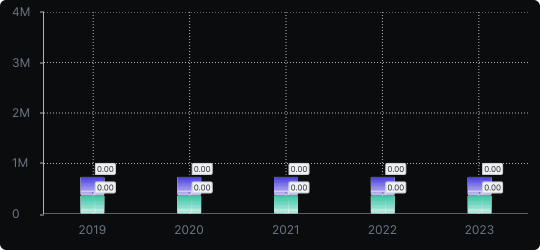
Stacked Vertical Bar Chart
A vertical bar chart that layers multiple data series within each bar, showing both the total and the composition of each category.


Comparison


Proportions


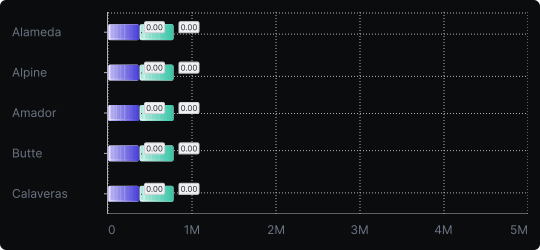
Stacked Horizontal Bar Chart
A horizontal bar chart that stacks multiple data series within each bar, combining compositional detail with easy label readability.
Comparison
Proportions


