





Matrix Chart

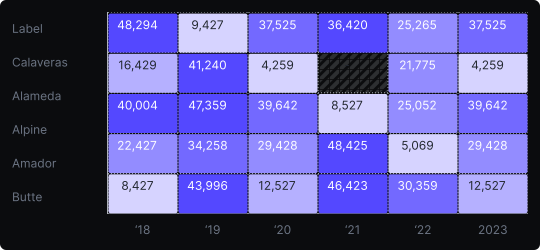
Matrix (Heatmap)
A matrix heatmap encodes numerical values as colors within a grid of rows and columns. Each cell represents the intersection of two categorical variables, and its color intensity reflects the magnitude of the corresponding value.
When to use it?
Use a matrix heatmap to reveal patterns across a two-dimensional space — such as correlations between variables, activity levels by time and day, or geographic distributions by category. It is particularly powerful for spotting clusters and anomalies in large tabular datasets.
What makes it effective?
Color as a channel allows the viewer to absorb hundreds of data points at once without reading individual values. Patterns, hot spots, and cold zones emerge immediately from the color gradient.
When to avoid it?
Heatmaps require a well-chosen color scale — a poor palette can create misleading impressions. They are also not ideal when precise numerical comparison is needed, as humans are less accurate at reading color differences than length differences. For exact values, complement with tooltips or annotations.
Use diverging color scales for data centered around a meaningful midpoint (e.g., correlation from –1 to +1), and sequential scales for data that flows from low to high.
Similar Charts

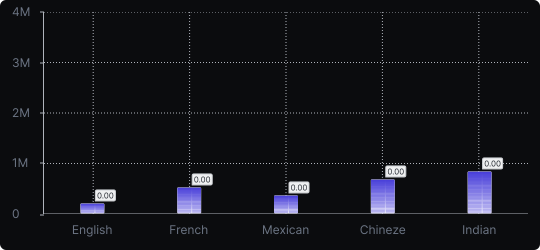
Vertical Bar Chart
The most common way to compare amounts: one vertical bar per category, with bar height showing the value. Clear, familiar and easy to read at a glance.


Comparison


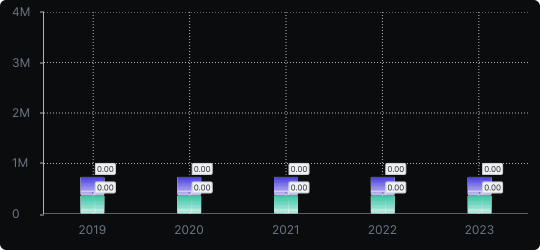
Stacked Vertical Bar Chart
A vertical bar chart that layers multiple data series within each bar, showing both the total and the composition of each category.
Comparison


Proportions


