





Line Chart

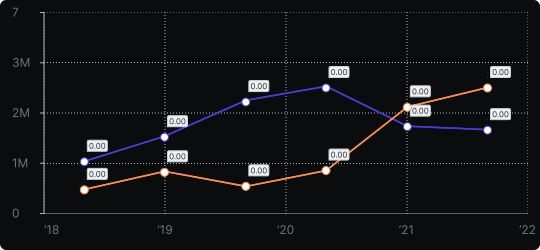
Line Chart
A line chart connects data points with straight lines to reveal trends, patterns, or changes over time. It is one of the most fundamental and widely used chart types in data visualization.
When to use it?
Use a line chart whenever your data is continuous and ordered — most commonly for time-series data such as revenue over months, temperature over days, or website traffic over weeks. It is also appropriate for any sequential domain where the direction of change matters.
What makes it effective?
The line itself communicates movement and direction. Rising lines signal growth, falling lines signal decline, and fluctuations reveal volatility. Multiple lines enable easy comparison of trends across different series.
When to avoid it?
Avoid line charts for categorical data with no inherent order — connecting unrelated categories with a line implies a continuity that doesn't exist. For such cases, a bar chart is more appropriate.
Line charts are the default choice for time-series analysis. Keep the number of lines manageable (ideally under 5–6) to avoid visual confusion, and use distinct colors or dash styles to differentiate series.
Similar Charts

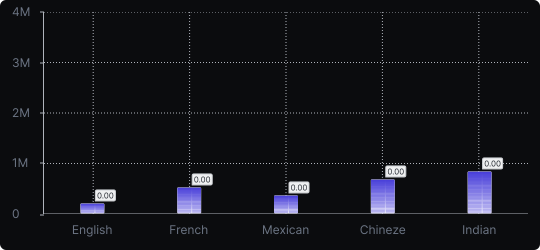
Vertical Bar Chart
The most common way to compare amounts: one vertical bar per category, with bar height showing the value. Clear, familiar and easy to read at a glance.


Comparison


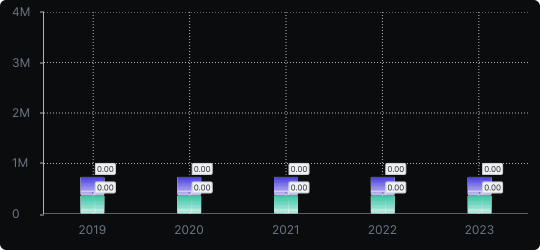
Stacked Vertical Bar Chart
A vertical bar chart that layers multiple data series within each bar, showing both the total and the composition of each category.
Comparison


Proportions


