





Box Plot

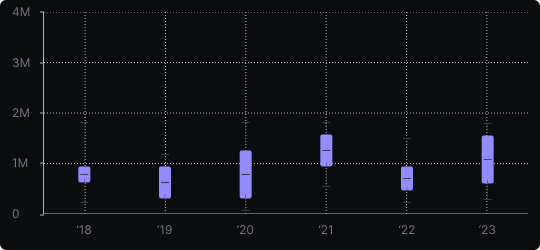
Box Plot (Box-and-Whisker)
A box plot summarizes the distribution of a numerical variable using five key statistics: the minimum, first quartile (Q1), median, third quartile (Q3), and maximum. The box spans Q1 to Q3 (the interquartile range), a line marks the median, and whiskers extend to the data extremes, with dots marking outliers beyond a defined threshold.
When to use it?
Box plots are essential when comparing the distribution of a numerical variable across multiple groups — for example, salary distributions by department, or test scores by school. They condense a full distribution into a compact, comparable form.
What makes it effective?
In a single symbol, a box plot communicates central tendency (median), variability (box width), skewness (asymmetric box or whiskers), and the presence of outliers. This makes it far more informative than showing only a mean or bar.
When to avoid it?
Box plots can be misleading when distributions are bimodal or complex, as the summary statistics hide the underlying shape. In such cases, combine with a violin plot or individual data points (strip plot) for a fuller picture.
Box plots are the standard tool for distribution comparison in statistical analysis and scientific communication.
Similar Charts

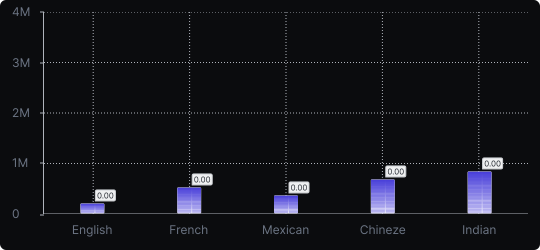
Vertical Bar Chart
The most common way to compare amounts: one vertical bar per category, with bar height showing the value. Clear, familiar and easy to read at a glance.


Comparison


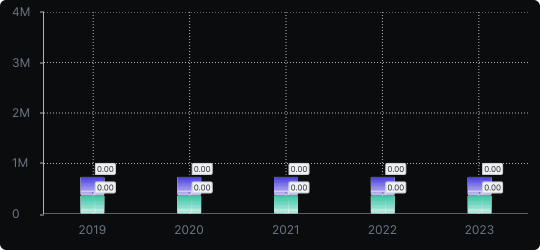
Stacked Vertical Bar Chart
A vertical bar chart that layers multiple data series within each bar, showing both the total and the composition of each category.
Comparison


Proportions


