





Scatter Plot

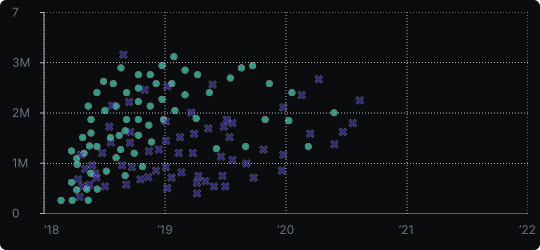
Scatterplot
A scatterplot displays individual data points as dots positioned according to two numerical variables — one on the x-axis and one on the y-axis. Each dot represents a single observation, and the overall pattern of dots reveals the relationship between the two variables.
When to use it?
Use a scatterplot when you want to explore whether two variables are correlated, clustered, or independent. It is essential in exploratory analysis, regression diagnostics, and quality control.
What makes it effective?
Scatterplots show the full distribution of a bivariate dataset — not just summaries. They expose clusters, outliers, and non-linear patterns that summary statistics alone would hide.
When to avoid it?
With very large datasets, overlapping dots (overplotting) make patterns hard to see. In such cases, use transparency, jittering, hexbin plots, or density contours. Also avoid scatterplots when comparing categorical variables — a bar or box plot is more appropriate.
Enhance scatterplots by adding a trend line, color-coding a third variable, or sizing dots by a fourth variable to add more dimensions to the story.
Similar Charts

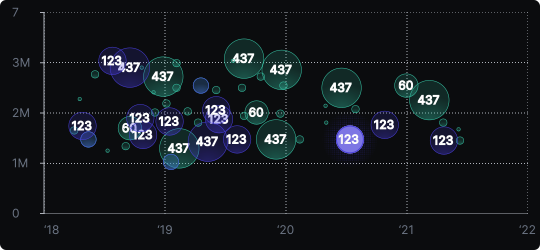
Bubble Chart
A scatter plot where bubble size adds a third variable, so three measures can be compared in one view, such as cost, volume and growth.


Correlation


Comparison


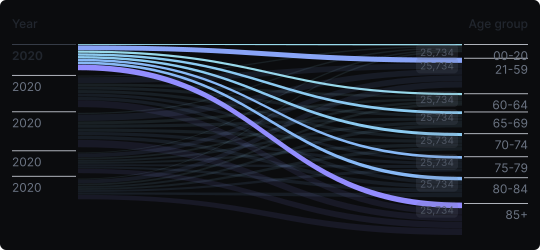
Sankey Diagram
A flow diagram where ribbon width encodes quantity, showing how values are distributed or transferred between stages and categories across a system.
Correlation
Comparison


