 CorLab AI Agent


This Tech Assistant is designed to support you with clear insights into our company, our work, our services and the people behind our progress.
Powered by CorLab Tech © 2025







KPI Cards for Dashboards
A KPI card is a dashboard component that shows one key metric at a glance: the current value, how it compares with a target or the previous period, and which way it is moving. The four examples below show how the same pattern adapts to clinical, retail, weather and fitness data.


What KPI cards work best for

Performance monitoring
Track key metrics against targets, benchmarks, or previous periods in real time.
Executive summaries
Surface the most critical numbers upfront, giving decision-makers instant clarity without digging into charts.
Progress tracking
Highlight movement toward a goal, showing whether a metric is on track, improving, or needs attention.

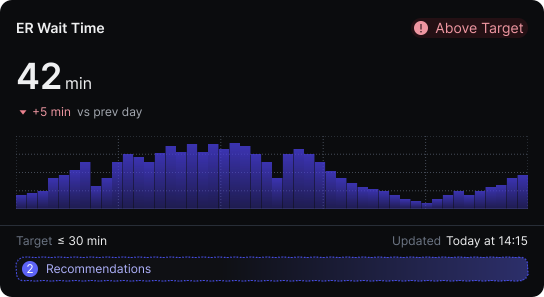
Healthcare KPI Card
A clinical KPI card for monitoring time-sensitive medical metrics against defined safety targets, with historical trend context and AI-powered recommendations.


Trend


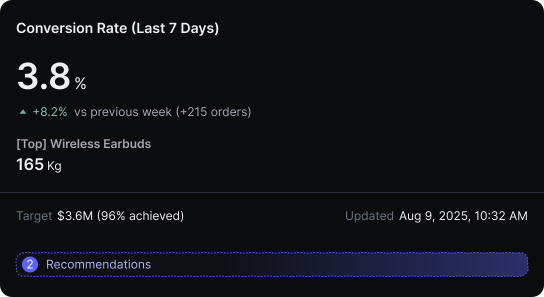
Retail and E-commerce KPI Card
A sales-focused KPI card that tracks conversion and revenue performance against targets, with top-product highlights and progress toward period goals.


Comparison

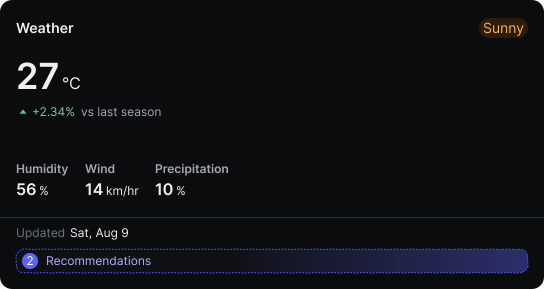
Weather KPI Card
An environmental KPI card that shows current conditions with supporting metrics, for dashboards where weather affects operations or business decisions.
Comparison

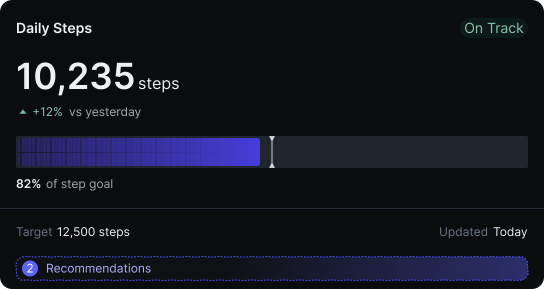
Sport and Fitness KPI Card
A personal performance KPI card that tracks daily activity against goals, with progress and trend views that keep users motivated.
Trend
Need KPI cards built on your own data?
CorLab Tech builds custom dashboards and KPI views on top of your own data: connected to your systems, with targets and alerts set around how your team makes decisions.

See dashboard development
Questions and answers
Frequently Asked Questions
Quick answers on designing KPI cards and using them in a dashboard.


What is a KPI card?
A KPI card is a small dashboard component built around one metric. It shows the current value in large type, a comparison with a target or previous period, and often a small trend line, so the reader knows in seconds whether things are on track.


What should a good KPI card include?
How many KPI cards should a dashboard have?
Can CorLab Tech build KPI cards connected to our data?
What is the difference between a KPI card and a KPI dashboard?
Which metrics belong on a KPI card?
We would like to load Google Tag Manager, which brings Google Analytics and a Google Ads audience tag with it, and Microsoft Clarity, which records how pages are used (clicks, scrolling, mouse movement) so that we can see where the site is hard to use. None of that is needed for the site to work, so it only loads if you agree, and you can change your mind at any time from the footer. Separately, Cloudflare measures this site's own performance without cookies and without identifying you; that runs either way and is explained in our Privacy Policy.